This page is no longer being supported, please see the new website.
Finding Data on the Internet http://www.inside-r.org/howto/finding-data-internet
R packages for connecting to APIs:
coinmarketcapr: Connecting to Coin Market Cap to get Cryptocurrencies Market Cap Prices (https://github.com/amrrs/coinmarketcapr).rtweet: R client for accessing Twitter [stream and REST] API http://rtweet.info and https://github.com/mkearney/rtweetepidata: R package to link to the API at http://www.epi.org/. The Economic Policy Institute provides researchers, media, and the public with easily accessible, up-to-date, and comprehensive historical data on the American labor force. It is compiled from Economic Policy Institute analysis of government data sources. Use it to research wages, inequality, and other economic indicators over time and among demographic groups. Data is usually updated monthly.acs: R package to link to the API at https://www.census.gov/data/developers/data-sets.html. Provides a general toolkit for downloading, managing, analyzing, and presenting data from the U.S. Census, including SF1 (Decennial short-form), SF3 (Decennial long-form), and the American Community Survey (ACS).Rfacebookpackage: Access to Facebook API via R (https://github.com/pablobarbera/Rfacebook)tidyhydat: Canadian hydrometric data — Historical data is contained within HYDAT, the Canadian national Water Data Archive, which is published quarterly by the Government of Canada’s Department of Environment and Climate Change. Data in this archive range from 1850 to 2017. tidyhydat also provides functions to access real-time data over the web. This package would be of interest to anyone who has need for Canadian hydrometric data in R.ipumsr: An easy way to import census, survey and geographic data provided by ‘IPUMS’ into R plus tools to help use the associated metadata to make analysis easier. ‘IPUMS’ data describing 1.4 billion individuals drawn from over 750 censuses and surveys is available free of charge from our website <https://ipums.org>.ess: Download data from the European Social Survey directly from their website <http://www.europeansocialsurvey.org/>. There are two families of functions that allow you to download and interactively check all countries and rounds available.data360r: Makes it easy to engage with the Application Program Interface (API) of the TCdata360 and Govdata360 platforms at <https://tcdata360.worldbank.org/> and <https://govdata360.worldbank.org/>, respectively. These APIs provide access to over 5000 trade, competitiveness, and governance indicator data, metadata, and related information from sources both inside and outside the World Bank Group. Package functions include easier download of data sets, metadata, and related information, as well as searching based on user-inputted query.lahman: Provides the tables from the ‘Sean Lahman Baseball Database’ as a set of R data.frames. It uses the data on pitching, hitting and fielding performance and other tables from 1871 through 2015, as recorded in the 2016 version of the database.wbstats: Women in Parliament dataset and link to worldbank: https://github.com/saghirb/Women-in-Parliament-Hex-Sticker
R packages containing multiple datasets:
gibboda: Gender Isn’t Binary But Other Data Are! (https://github.com/bryandmartin/gibboda).openintro: R package for data and supplemental functions for OpenIntro resources (https://github.com/OpenIntroStat/openintro)tidyverse: suite of R packages that contain some fantastic datasets (https://www.tidyverse.org/)fivethirtyeight: an R package (https://cran.r-project.org/web/packages/fivethirtyeight/vignettes/fivethirtyeight.html) that pulls in data that 538 has already publicly posted (https://github.com/fivethirtyeight/data)
Dynamic Data Sets / Databases:
- College Scorecard (https://collegescorecard.ed.gov/). A tremendous amount of information about all universities (though some of it collected only from students on financial aid).
- National Park Service Visitor Use Statistics (https://irma.nps.gov/Stats/)
- Financial and Economic data (https://www.quandl.com/)
- Behavioral Risk Factor Surveillance System: http://www.cdc.gov/brfss/
- General Social Survey (http://www3.norc.org/GSS+Website/)
- National Health and Nutrition Examination Survey from the CDC: http://www.cdc.gov/nchs/nhanes/nhanes_questionnaires.htm
- Medicare dataset (discussed on whitehouse.gov)
- State Health Facts: http://www.statehealthfacts.org/
- gapminder.org – a fascinating website with amazing graphics (social and economic data broken down by country). Click on the spreadsheet links to download the data.
- Wolfram/Alpha (http://www.wolframalpha.com/ )– This is billed as a computational search engine. Put in “nachos” you get a detailed nutritional analysis, put in “GDP of Albania”and you get several forms of GDP, a historical graph and other economic variables, put in your favorite college and get lots of info (including number of degrees in mathematics in 2009, location on a map and link to a satellite view of campus). While the case by case data display is not so convenient for building datasets there are pretty good links to the sources that Wolfram is pulling data from. For example, the Wolfram/Alpha page of info on a college or university has a data source link at the bottom to the National Center For Educational Statistics website where you can download your own custom data files from the IPSEDS (Integrated Post Secondary Education Data System) – want to know the average faculty salary by rank for all the schools in your comparison group? or the nacho search gives a link to the USDA’s National Nutrient database and a few clicks later I’ve got a spreadsheet with data on 50+ nutrients in 7400+ foods (and that’s the abbreviated data!)
- The Census Bureau
- Baby names (popularity by year and state), compiled by the Social Security Administration
New & Continuously Revised Static Data Sets / Databases:
- hate speak corpora, particularly good for training NLP models
- The R package
dslabshas some great datasets, described in this Simply Statistics blog - Information is Beautiful: https://informationisbeautiful.net/data/
- CDC health datasets which are freely available and formatted. https://www.cdc.gov/nchs/To be analyzed correctly, these survey data require proper weighting, clustering and stratification adjustments. There are many such datasets available, including NHAMCS (OPD and ED), NAMCS, BRFSS, NSFG, NHIS, NIS-Child, NIS-Teen, NHANES, NVSS. A quick google of any of these acronyms will take you directly to each webpage.
- kaggle.com is a repository for data used in analysis competitions.
- http://archive.ics.uci.edu/ml/datasets.html — UC Irvine’s Machine Learning Repository (huge and fantastic database!).
- The GitHub site and other info for many of 538’s analyses.
FiveThirtyEight.com has been very forward thinking in making the data and code used in many of their articles accessible on GitHub. With consultation from Andrew Flowers and Andrei Scheinkman of FiveThirtyEight, we go one step further in our package by pre-processing the data so that it more accessible statistics and data science novices and providing ample documentation in the help files.
For a usage example, click here. For a more detailed outline of all data sets and a discussion on our motivation and data guidelines, see the package vignette.
And this: How to explore data from 538
- Data is Plural set of fun and interesting new datasets (http://tinyletter.com/data-is-plural/archive) and the spreadsheet with all the info is at: https://docs.google.com/spreadsheets/d/1wZhPLMCHKJvwOkP4juclhjFgqIY8fQFMemwKL2c64vk/edit#gid=0
- The StudentLife Study. Back in 2013, four dozen Dartmouth College students agreed to let a custom smartphone app surveil them for the StudentLife Study. During the 10 weeks of the spring academic term, the app collected data on the students’ physical activity, GPS coordinates, eating schedule, sleep habits, phone usage, and more. The study combined all that information with a slew of other data, including the students’ class deadlines, academic performance, and their responses to surveys about stress, depression, personality, and sleep quality. The study’s public (and anonymized) dataset clocks in at 53 gigabytes. (http://studentlife.cs.dartmouth.edu/)
- Shonda Kuiper (Grinnell College) has put together many data resources: http://web.grinnell.edu/individuals/kuipers/stat2labs/DataResources.html
- realclimate.org keeps an up to date catalogue of many different types of climate data (http://www.realclimate.org/index.php/data-sources/)
- An analysis of Denny’s vs LaQuinta restaurants (https://github.com/rundel/Dennys_LaQuinta_Chance)
- American Time Use survey (https://github.com/swang87/atus)
- FEC contributions data (as part of Hadley Wickham’s dplyr package)
- Yahoo big data datasets
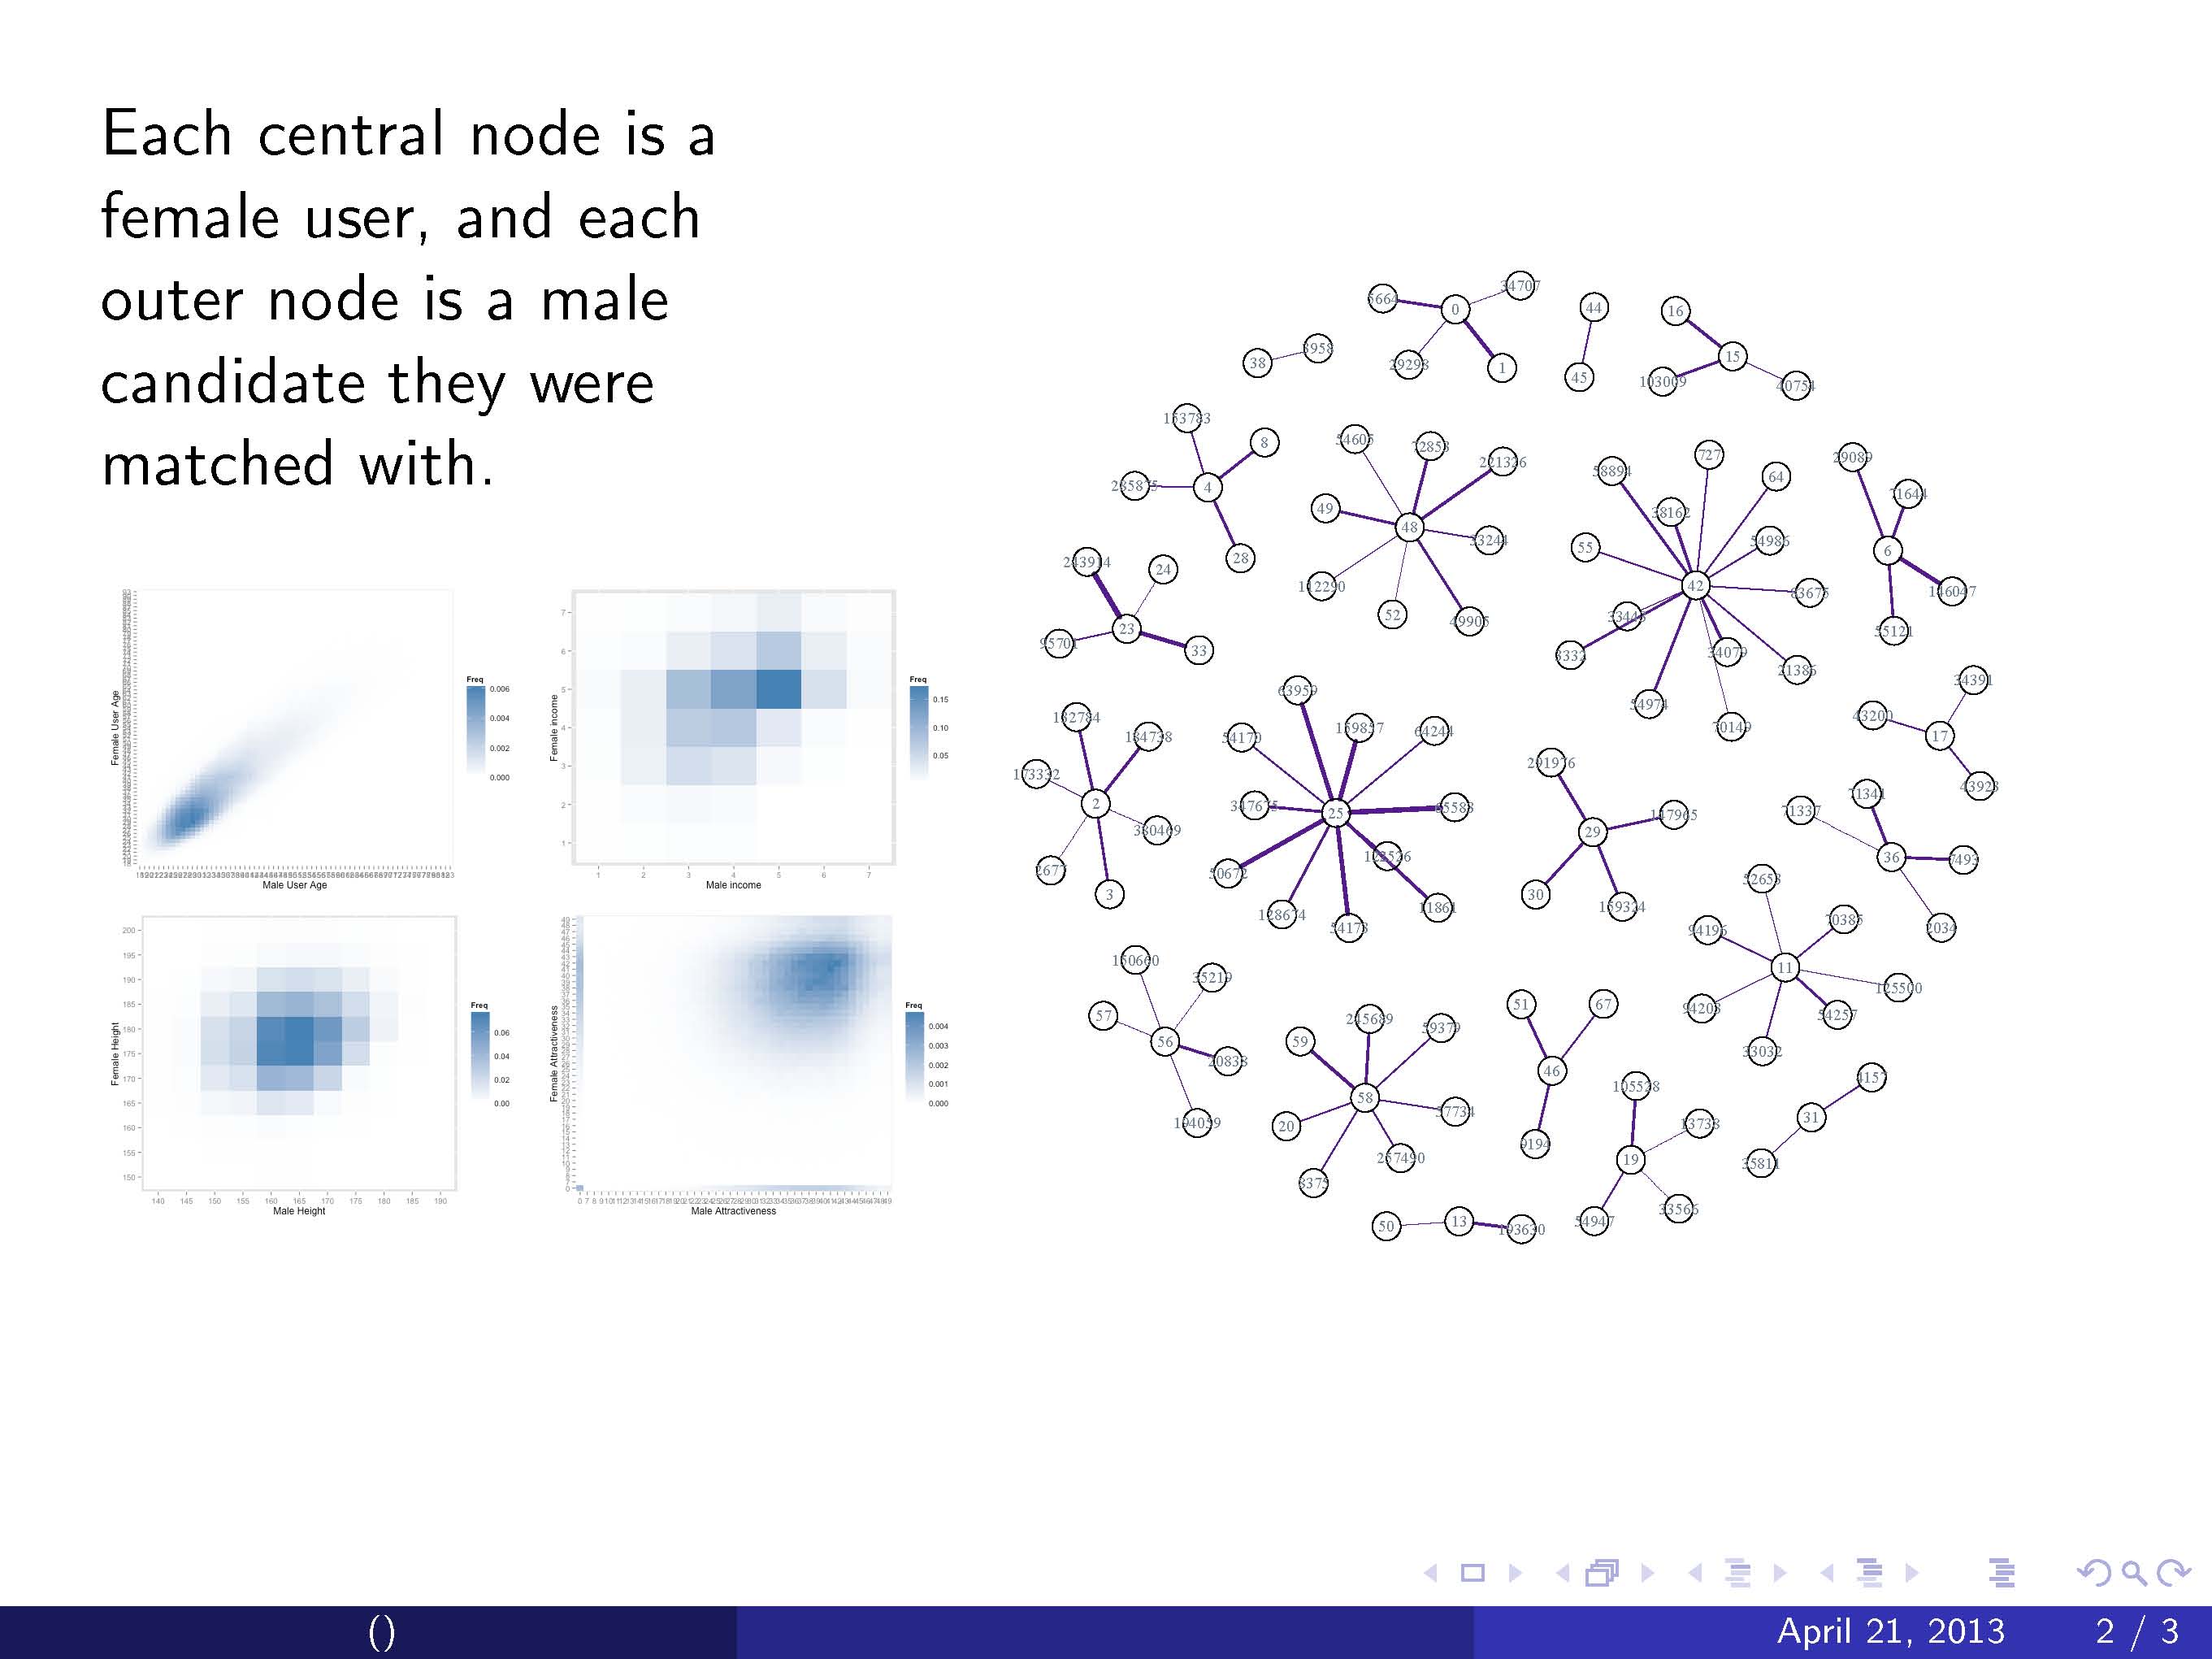
- SF OKCupid Users Everett Wetchler wrote a python script back in the day to rip the public profiles of San Francisco OkCupid users. He pulled one snapshot (June 26, 2012) of all OkCupid users who lived within 25 miles of San Francisco along with other caveats. It might be of interest to students given the recent press that data-driven approaches to online dating have been getting, specifically the Wired article “How a Math Genius Hacked OkCupid to Find True Love” and Amy Webb’s Ted Talk “How I hacked online dating”.
- This growing dataset repository presents raw data from real medical studies and offers (a) a vignette summarizing the study, research question and study design; (b) a data dictionary with clear documentation of variables and codes; (c) a complete citation for the associated study publication; and (d) a variety of data formats compatible with the majority of statistical packages. http://www.lerner.ccf.org/qhs/datasets/
- Teaching Statistics in the Health Sciences (https://www.causeweb.org/tshs/category/dataset/)
- Data formatted to use in R http://www.icpsr.umich.edu/icpsrweb/ICPSR/support/announcements/2013/03/icpsr-releases-new-datasets-in-r-format
- Journal of Statistics Education Data Archive – datasets contributed by statistics teachers. Raw data are given in a .dat file with explanations of the variables in an accompanying .doc file. Several of these datasets are tied to longer JSE articles discussing their use in statistics classes. For example, try televisions.dat, televisions.txt, and Rossman article for some data on life expectancy and numbers of televisions in various countries.
- DASL is the Data and Story Library – a collection of datasets and related documentation which may be searched by data subjects or by statistical techniques
- Jason Bryer’s website (http://jason.bryer.org/); he maintains quite a few R packages which include some cool datasets
- Awesome public datasets… https://github.com/caesar0301/awesome-public-datasets/blob/master/README.rst
- Bessie Chu‘s compilation of datasets: https://docs.google.com/document/d/1w7KhqotVi5eoKE3I_AZHbsxdr-NmcWsLTIiZrpxWx4w/pub
- 18 places to find data sets for data science projects
- Lots of fun data from https://www.openintro.org/
-
Ebay auction data for Mario Kart game on the Wii
Some of the variables: total auction price, game condition, auction duration, and number of “Wii wheels” (Wii wheels are accessories used when playing the game). See Chapter 8 of the OpenIntro Statistics textbook to review a multiple regression analysis of the data set, e.g. download the textbook PDF at
-
Professor ratings and beauty
The data are gathered from end of semester student evaluations for a large sample of professors from the University of Texas at Austin. In addition, six students rated the professors’ physical appearance. Lab 8 at the link below provides a lab on multiple regression using this data set, and more info about this data set is available in the second link.
-
50 variables for each of the 3143 US counties
OpenIntro had an intern, Luke Paulsen, who did an interesting multiple regression analysis on a subset of these variables. See the “Data and Analysis” section of
www.openintro.org/stat/extras.php
More info on the data set:
-
Data for 50 companies in the S&P 500
Simple random sample of 50 companies from the 500 companies listed in the S&P 500. These data focus on financial information, which was collected on March 8, 2012. The variables include company value, revenue, cash on hand, debt, profit margin, plus other information for each of the 50 companies. Access the data from the zipped file of data sets available on the textbook page above or from the OIdata R package. It could be interesting to examine how the companies’ stocks performed since the data were collected. Such performance data could be collected pretty efficiently using the getReturns() function in the stockPortfolio package.
-
Pokemon Go! https://www.openintro.org/stat/data/?data=pokemon
A critical element of Pokemon Go is to “evolve” Pokemon into new, stronger Pokemon for battle. This data set examines evolutions of 75 Pokemon covering four species, and it offers a rich set of 27 variables. The data allow for a careful examination of critical questions related to Pokemon evolutions.
-
Journals / Journal articles that provide corresponding data:
- The GitHub site and other info for many of 538’s analyses.
FiveThirtyEight.com has been very forward thinking in making the data and code used in many of their articles accessible on GitHub. With consultation from Andrew Flowers and Andrei Scheinkman of FiveThirtyEight, we go one step further in our package by pre-processing the data so that it more accessible statistics and data science novices and providing ample documentation in the help files.
For a usage example and R package called fivethirtyeight, click here. For a more detailed outline of all data sets and a discussion on our motivation and data guidelines, see the package vignette.
And this: How to explore data from 538
- Journal of Cultural Analytics – https://culturalanalytics.org/category/data-sets/
- Nature – Many articles have a “Data availability” section. See Hurricane-induced selection on the morphology of an island lizard which includes a link to their data.
- Journal of Statistics Education – http://jse.amstat.org/ (check the archive) or more recent papers at https://www.tandfonline.com/toc/ujse/current
Static Data Sets / Databases:
- http://timetric.com/ — time-series data sets, uploaded by users.
- DASL in Australia
- Statlib Dataset Archive – one of the original sources for archived data
- National Institute of Standards and Technology (NIST) education data sets
- CHANCE Project Datasets – data from recent media coverage of current events. Only a few datasets here, but many excellent references to teaching applications of statistics in the news can be found at the main CHANCE page
- A data repository from statsci.org – a statistics and bioinformatics group in Australia http://www.statsci.org/datasets.html
Websites for Visualizing Data:
- Information is Beautiful (http://www.informationisbeautiful.net/)
- Many Eyes (http://manyeyes.alphaworks.ibm.com/manyeyes/) This is billed as a wiki for data and visualizations of data. Users can contribute datasets and graphics as well as comment on what others have contributed. Some of the “visualizations” are pretty bizarre – others are interesting, e.g. I’m not sure where else I could find different datasets (e.g. current average home rental prices) from counties in Ireland and display the data by shading a map of Ireland with the variable I choose and have a link to the report where the data appear. A search with keyword “golf” produced 14 hits – including several of which referred to the Volkswagen Golf, a couple where individual golfers posted datasets with their own scores (and quite detailed info for each round), listings of the length and price to play golf courses in the Toronto area, the World Gold Rankings Top 250 golfers (from 2007) and data on PGA Tour golfers (from ESPN) for the 2007 season.
- From Mark Ward at Purdue http://llc.stat.purdue.edu/2014/29000/visualsites.html
- Nathan Yau’s amazing visualizations: http://flowingdata.com/ (mostly including corresponding datasets)