Quality Metrics
Community quality metrics are measurements of how well communities are formed. Good metric values generally reflect networks where connections are denser within communities than between communities.
We are getting ready to implement various quality metrics in the Louvain method, an efficient and widely used community-detection algorithm. We will start with the metrics from this paper. Below are summaries of metrics that will be implemented.
- A cut splits vertices into two disjoint groups. Conductance compares the cost of a cut, which is the weight of the edges that were cut, to the weight of a group induced by that cut. High conductance values are favorable. Conductance is biased towards graphs with a small number of communities.
- Coverage compares the weight of all edges in communities to the total weight of the graph. High coverage values mean that more edges lie in communities than between communities. The metric is biased towards graphs with less communities and few singleton communities.
- Modularity is a popular quality metric that measures the number of edges in communities and the number of edges between communities to a random graph with similar characteristics (such as vertex degrees). High modularity values indicate that there are more-than-expected number of edges within communities and less-than-expected number of edges between communities. Note that modularity is coverage with an added factor of randomization. It’s biased towards graphs with a low number of singleton clusters.
- Performance compares the weight of edges in a community to the weight of edges that do not exist between nodes in this community and nodes in other communities. High performance values reflect a community that is internally dense and externally sparse. Performance is biased towards large, sparse graphs.
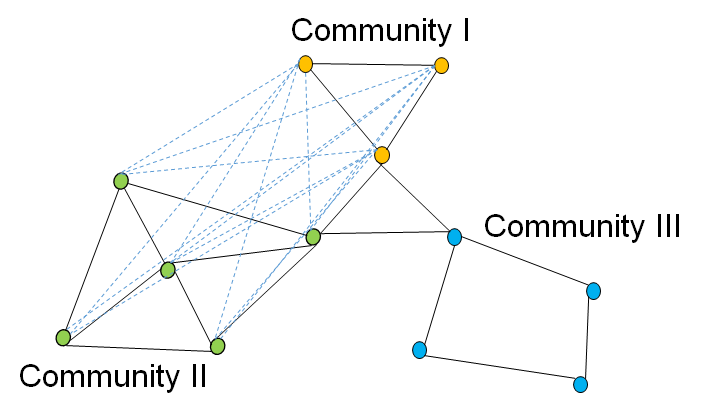
Dotted lines indicate edges that do not exist between communities I and II.
- Silhouette index is based on the concepts of cohesion and separation. Cohesion measures the closeness of nodes in clusters, and separation measures how distinct a cluster is from other clusters. High silhouette index values indicate that communities are both cohesive and separated. Unfortunately, silhouette index is expensive to calculate as it requires shortest path execution on all pairs of clusters, and it’s biased towards graphs with many singletons.