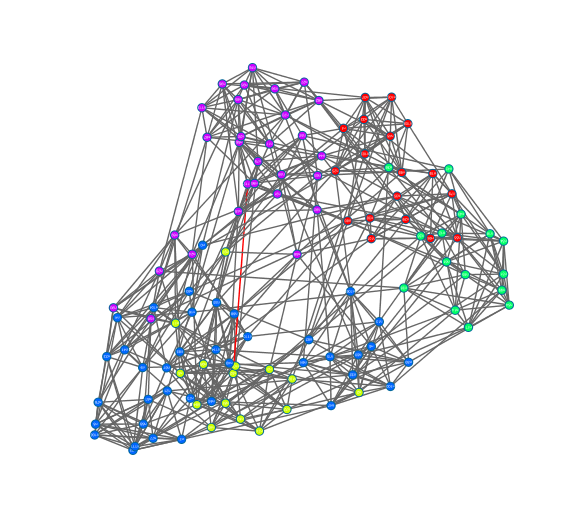
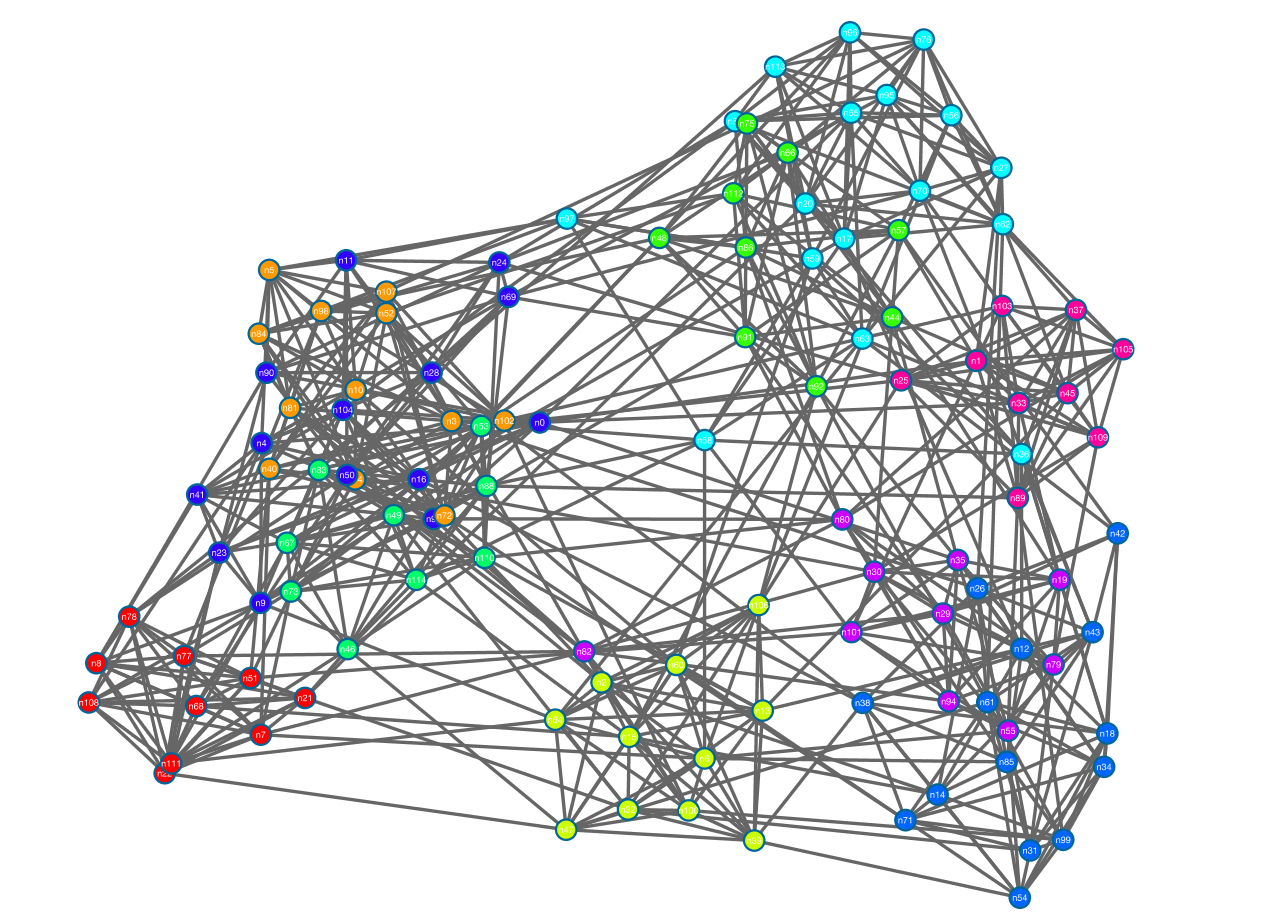
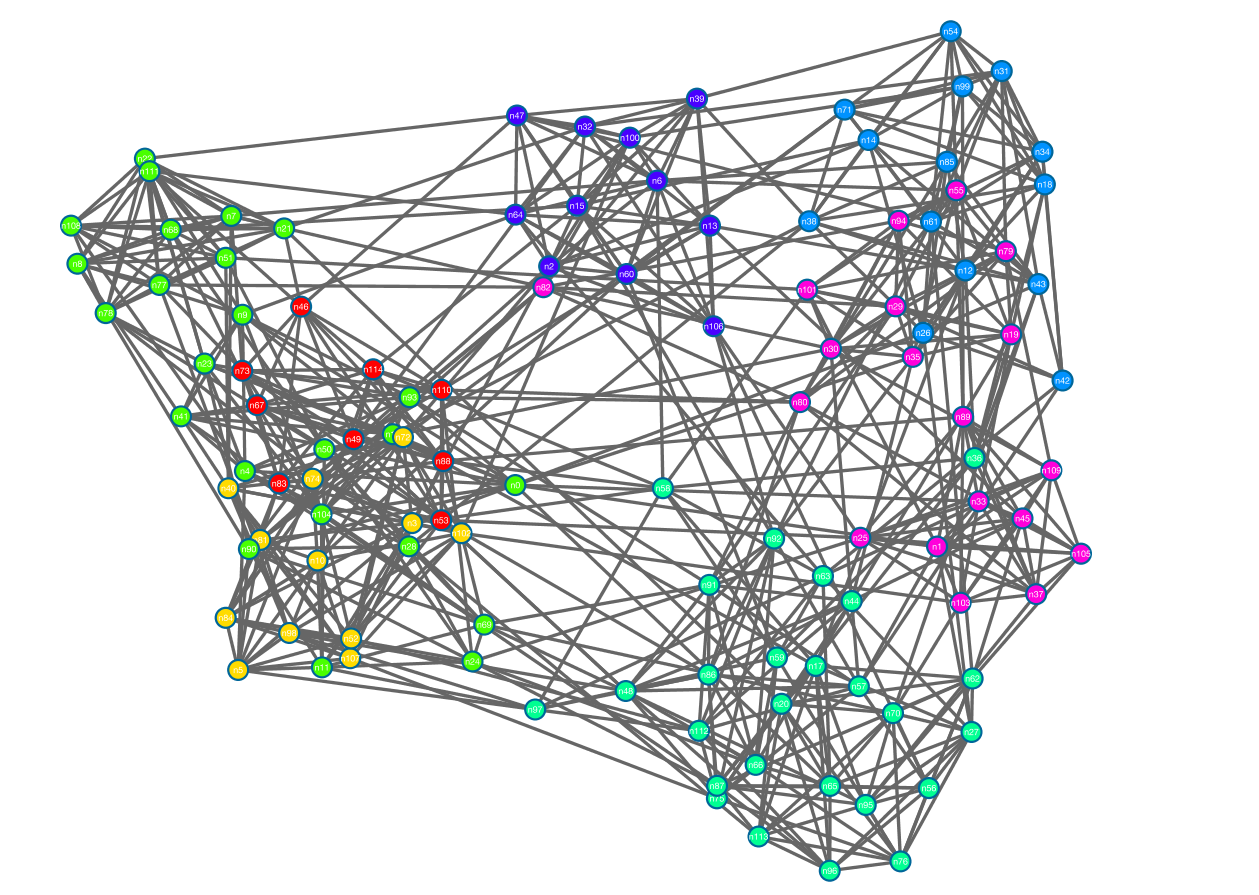
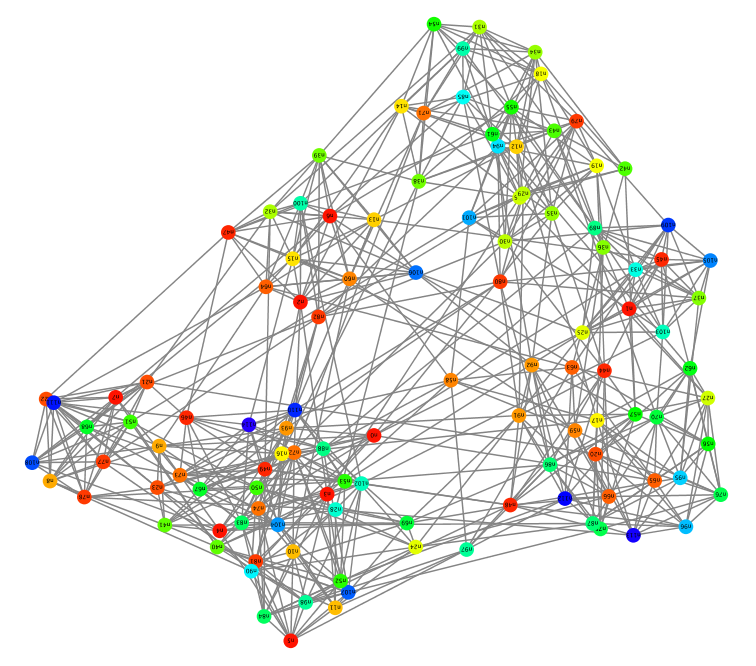
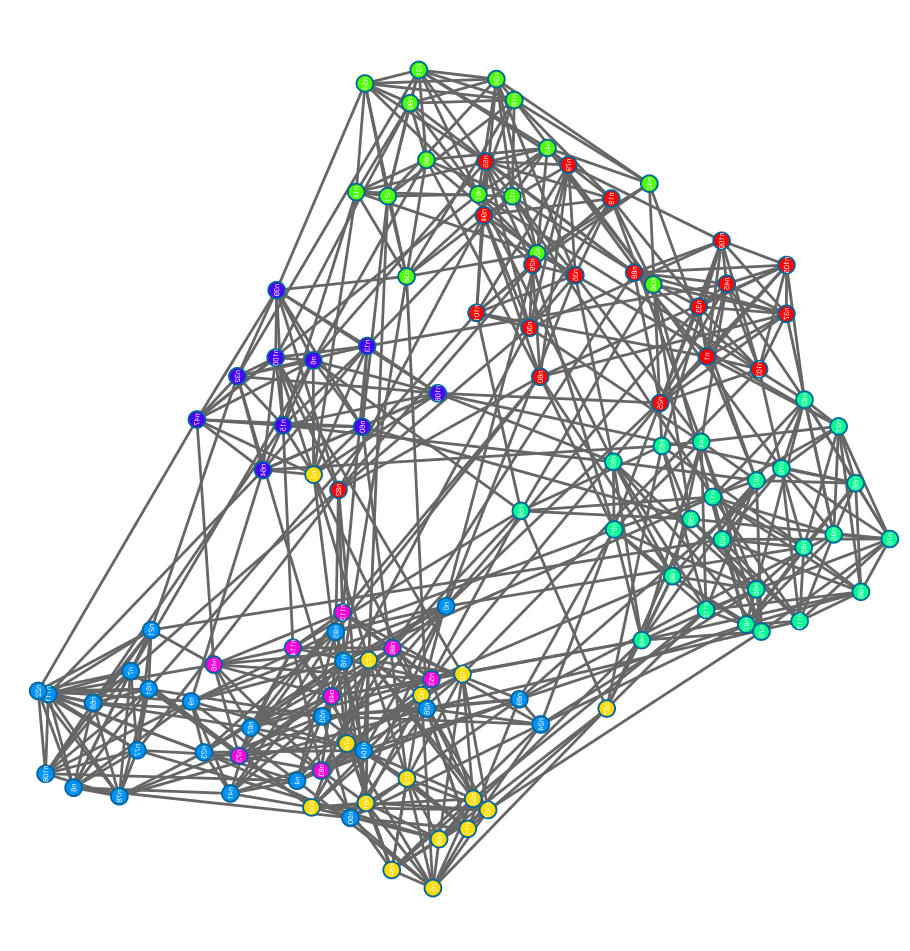
Clusterings on Football Graph
We’ve begun testing Louvain-silhouette and Louvain-performance on a test suite of thirty-six networks from the Stanford Large Network Dataset Collection and The University of Florida Sparse Matrix Collection.
One of our initial tests was on the football graph, which models American football games between NCAA Div IA colleges in Fall 2000 (from the UFL dataset). This undirected, weighted network has 115 vertices and 613 edges. Each vertex represents a football team, which belongs to a specific conference (Big Ten, Conference USA, Pac-10, etc.). An edge between two vertices v1 and v2 means that the two teams played each other; the weight of the edge (v1, v2) is equal to the number of times they played each other.
Below are visualizations (using Cytoscape) of the resulting clusterings generate by each version of the Louvain and CNM algorithms. We used the Edge-weighted Spring Embedded layout to distribute the nodes. That is, the heavier an edge (v1, v2), the closer together v1 and v2 will appear on the graph. Thus, this layout allows a visual approximation of communities.
Louvain-modularity:
Louvain-performance (with the meaningful maximum M set to max edge weight after removing extreme high outliers):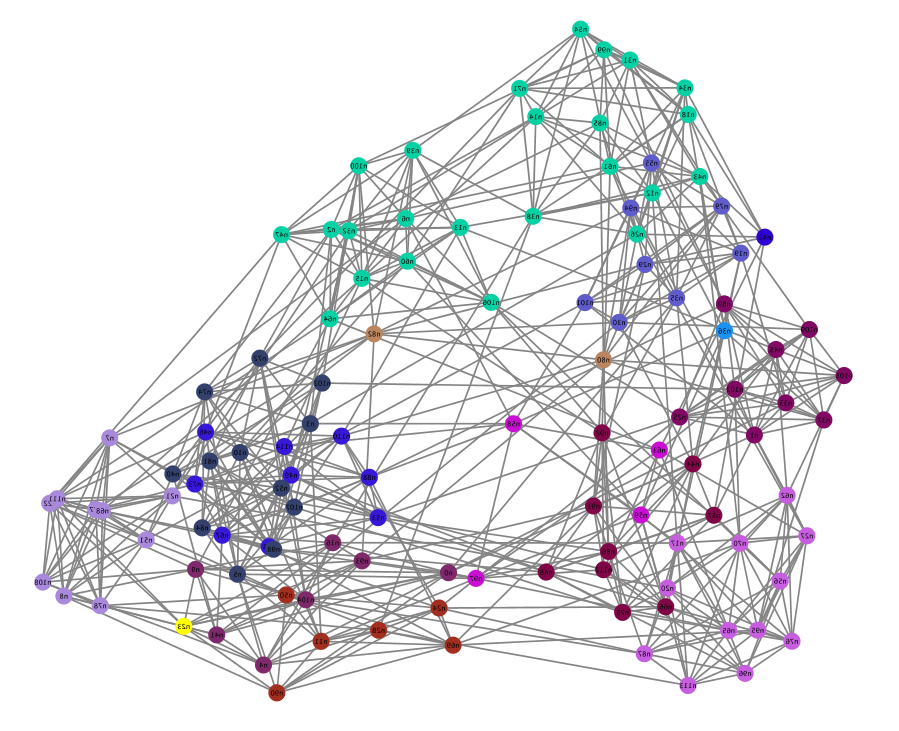
Louvain-coverage:
Louvain-silhouette:
CNM-modularity:
CNM-coverage: