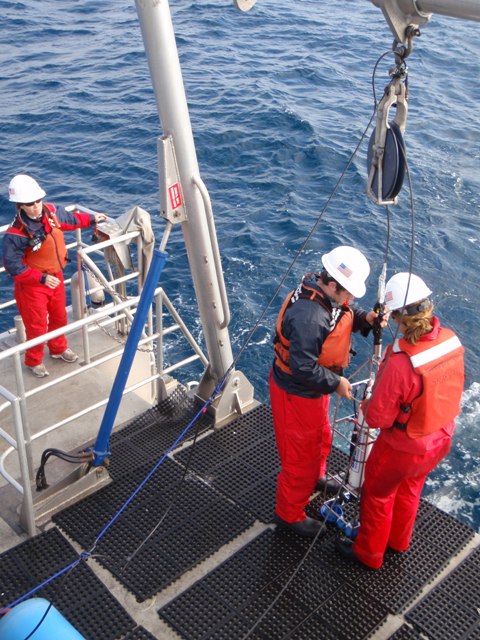
Bridge View! Kristen and Augie prepare to cast the CTD into the ocean on one of our many stations. Dani readies the winch.
As you all know, we have not been on a boat for a month. In fact, despite all these lovely blog entries about the high-seas and the creatures that live there, we’ve been in lab for several weeks working with data and creating colorful graphs and figures! Here is a sample of just one of the many graphs and maps Augie and I have made.
Temperature and ocean depth. This is a vertical slice of one of our transects. The white block is missing data do to a shallow cast.
This is a vertical section of ocean around SBI, and shows the changing temperature with depth. You can see the rapidly changing temperature around 15-20m. This is called the thermocline, and it is often the home to many marine primary and secondary producers. Our CTD recorded not only temperature, but also salinity, which changes with depth and temperature, fluorescence, which is a proxy for the amount of phytoplankton in the water, and water density. And we had 7 transects around the island! In short, we have a lot of graphs.
In order to get the data from the CTD into these readable figures, we had to download the data, decode it so our computers could read it, format it so we could then run it through another program especially designed for CTDs, and
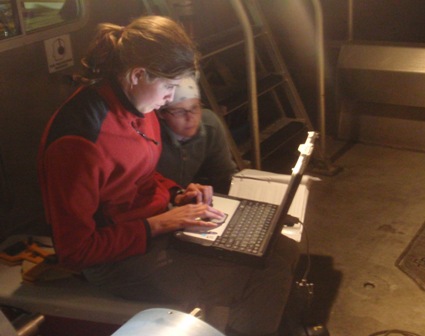
Kristen and Dani attempted to download data from our CTD onto our awesome, waterproof labtop.
then fiddle with the code so it matched our unique data. It was more complicated that it sounds.
We also have made several maps that are horizontal slices of the ocean at, say, 10meters all around the island. These are cool, because then we can lay our bird-densities over them and see what sort of environmental factors XAMU prefer. We’ll be able to do the same with the krill, once we have a better idea of what is in our samples.